Korea stewardship code
In line with our continued commitment to the Asian markets and our dedication to fulfilling our stewardship responsibilities, we have initiated the process of registering Metrica as a participant in the Korea Stewardship Code.
For further details, please refer to the following disclosure link here.
Seeds of doubt
RV spreads have been drifting wider since May 2024, and on one measure — the ratio between MSCI Value and Growth indices — levels are now back to multi-year extremes (figure below).
MSCI Asia-Pacific Value / Growth
Unusually, this has been happening during a time when US short-term and long-term rates are moving higher, a trend which is normally associated with outperformance of short-duration stocks (Value) over long (Growth). It means that either equity investors are ignoring the consequences of higher rates, or they are revising up growth expectations at a pace fast enough to outweigh the impact.
In any case, companies which are valued not on discounted cash flows but on hard assets – such as those in certain RV strategies – are now cheap again. But given that we have retraced back to the low point on the chart, can we expect a brighter period ahead for RV?
We believe that two recent developments have raised the probability in favour of “yes”.
The first is the release of the R1 large language model by Chinese AI firm DeepSeek. The seemingly rock-bottom development cost of this model has called into question the potential returns on the estimated one trillion dollars2 already invested or to be invested into generative AI. The concern is: if good quality models can now be created on the cheap, do we really still need all those Nvidia chips, power transformers and data centres?
The news significantly boosted the volatility of stocks in the space, and we expect this to continue, which should be a positive for RV strategy returns.
The second development is the threatened or actual imposition of tariffs by the US upon its trading partners. While on the face of it this should not be a great surprise given the record of the previous Trump administration, it may have unexpected consequences for inflation this time around. During the last episode, we had been through thirty years of declining prices, leaving companies barely able to pass on tariffs to their customers. This time however, the macroeconomic environment is clearly different. An upside surprise to inflation would result in higher volatility in long-duration stocks which naturally tend to be more sensitive to rate expectations.
This would have an even greater impact on RV performance given that it affects all long-duration securities – not just AI-related.
Looking ahead
Event-driven outlook
We begin 2025 with a survey of current opportunities in Metrica’s core strategies.
Firstly, in the event-driven (hard catalyst) strategy, one of the key performance drivers is the liquidity of the target universe, as it correlates with the frequency and depth of trading opportunities.
Figure 1 shows, as of the beginning of each year, the average daily turnover of M&A targets listed in Asia-Pacific (the coloured bars) or listed outside Asia-Pacific but where the acquirer is paying in shares listed in Asia-Pacific (the grey bars marked “Other”).
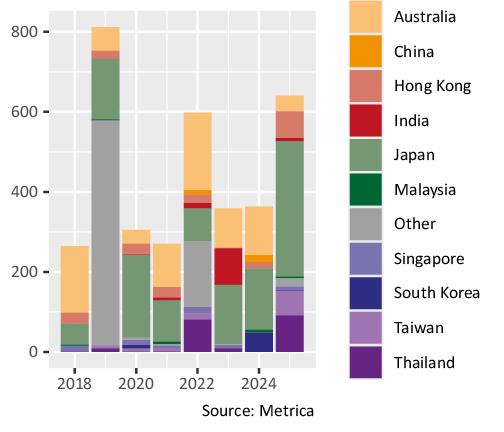
Figure 1: Daily liquidity of Asia-Pacific M&A deals at start of year, 2018 to date
The chart shows how daily liquidity in the Asia- Pacific M&A universe has improved to a post-2019 high of $641 million, and is 77% higher than a year ago.
Japan has driven much of the increase, which is not a surprise given sustained low-interest rates, corporate succession issues and a resurgent investor focus on balance sheet inefficiencies and governance reform. With many deals subject to upside tension from competitive bidders and/or shareholders unhappy with low-balled terms, Japan should continue to provide a key source of opportunities in the event-driven space.
Similarly, Hong Kong continues to see healthy deal activity, although in this case it is largely from major shareholders seeking to privatise companies at historically cheap valuations, with a view to relisting elsewhere. Many transactions are driven by state-owned enterprises (SOE), and in this regard we were pleased to see the recent guidelines for SOEs published by the State-owned Assets Supervision and Administration Commission (SASAC), which explicitly mention share price performance and valuation as criteria for manager evaluation. The guidelines should incentivise more SOEs to tackle the under-valuation of their Hong Kong-listed shares, creating further trading opportunities in this market.
RV outlook
Turning to the relative value strategy, we first update the value vs. growth draw-down chart featured in past newsletters (figure 2). As a reminder, the french series is Professor Kenneth R. French’s dataset of US stocks which goes back almost one hundred years, and the mxap series is based on MSCI Asia-Pacific which has less history but which is more applicable to the fund’s core universe.
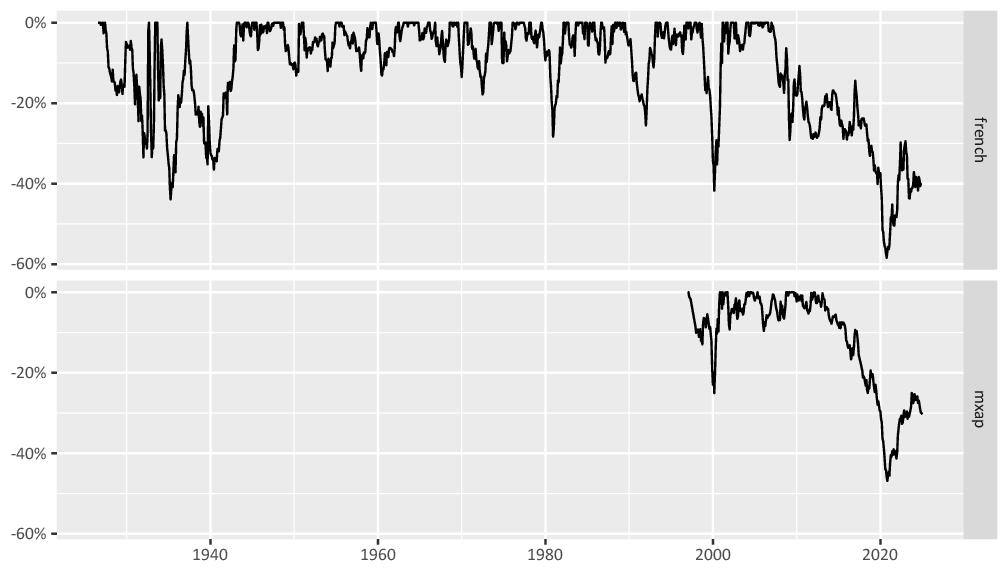
Figure 2: Draw-down from peak return for value vs. growth, 1926 to present
The chart shows the extent to which value investing (and by extension, RV investing) is or is not working4. It can be seen that, following a very steep draw-down in 2020, value has retraced around one-third of its way back to the long-term path. Longer-term, there is still around 40%+ upside to reach the 0% level.
The retracement trend paused a little over the past year as momentum factors took over. By some measures, 2024 was a record year for momentum strategies5, with the US stock market in particular posting its largest two-year gain since 1998.
While it is obviously difficult to call the top of any trend, it would be quite unusual by historical standards to see this extend into a third year. As such, the value factor may come back into favour in 2025, with positive implications for relative value strategies.
Nevertheless, given the partial retracement of value performance, does this mean that the best days are already over for RV strategies?
“Not at all” would be our answer. Looking at a weighted average discount to fair value for a representative sample of RV names shows how it ended 2024 at roughly the same level as it reached 30 months ago (on 17 June 2022 – dashed line in figure 3 – note the reversed axis), despite the value factor rebound.
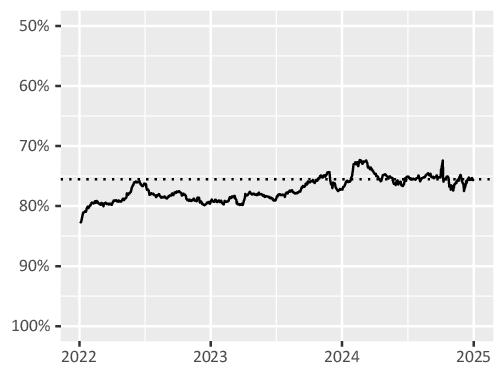
Figure 3: Weighted average discount to fair value of sample RV names (discount compression trades), 2022 to date
Value-up index announced
Korea Exchange released the details of its long-awaited Korea Value-up index.
As expected, not one non-financial holding company was included in the index, although many listed subsidiaries were. This was not a surprise to us, as we have not seen wholehearted participation in Corporate Value-up (CVU) by any of the nonfinancial holding companies with the exception of LG Corp. We expect this to change over time following pressure by investors, regulators and the stock exchange.
The index constituent announcement had a mild impact on the related stocks. Prior to the announcement, the performance of constituents and non-constituents was similar (figure 1). Subsequently, constituents then outperformed the others by around 2%.
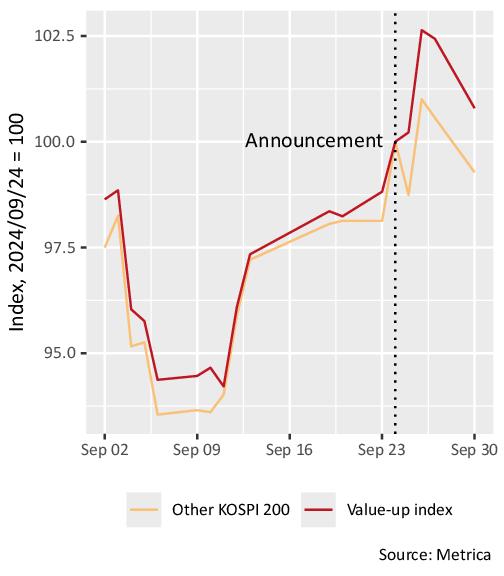
Figure 1: Korea Value-up index constituent performance before and after the announcement, compared with non-constituent KOSPI 200 index members, equally-weighted
Meanwhile the valuations of listed non-financial holding companies are still pricing in very low expectations for CVU.
Figure 2 shows the discount to listed NAV (ignoring unlisted assets) of the most liquid Korean holding companies with at least 200% of market capitalisation made up of stakes in other listed companies. While discounts contracted in early 2024 thanks to the initial CVU announcements, this move was quickly reversed and the group now trades 15pp lower than it did less than two years ago.
We view this as an attractive level to be exposed to corporate governance improvements in Korea (CVU or otherwise), and the fund maintains a larger-than-normal gross exposure to the market.
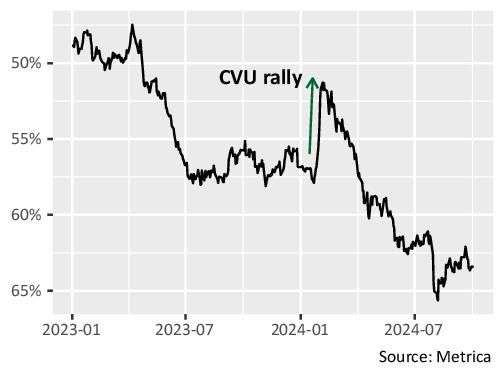
Figure 2: Discount to listed assets of Korean holding companies, January 2023 to present (Includes companies trading at greater than 50% discount as of end date).
Is this it? part II
Investors in Hong Kong and mainland Chinese stocks have been waiting a long time for the market to stop falling. In April we saw the beginnings of a tentative rebound, spurred by the announcement of shareholder-friendly reforms by the China Securities Regulatory Commission and positive macro / earnings headlines, but hopes were dashed soon after as the rally lost steam.
Now we have another attempt by Hong Kong / mainland China to break out of its multi-year bear market. The catalyst seems to be a monetary stimulus package announced by the People’s Bank of China (PBOC) on 23 September. It includes:
- lowering reserve requirement ratios by 0.5pp and the main policy interest rate by 0.2pp, with further cuts possible by year-end;
- cutting mortgage rates for existing home loans by roughly 0.5pp and reducing the nationwide minimum down payment requirement for second homes from 25 percent to 15 percent, while increasing funding support for converting excess housing inventory into affordable housing; and
- supporting the stock market by allowing institutional investors to borrow liquid assets directly from the central bank to invest in equity markets, while lending to banks supporting companies to buy back their own shares.
This has had a dramatic impact on sentiment in the Hong Kong and mainland Chinese markets, causing the Hang Seng and CSI 300 indices to rally by 15.8% and 25.1% respectively from the announcement to 1 October.
Even after the rally, we still see valuations as low, at least in the Special Administrative Region. Figure 1 shows how the forward price-to-book ratio of the Hong Kong market is still not far above a twenty-year low at 1.0x.
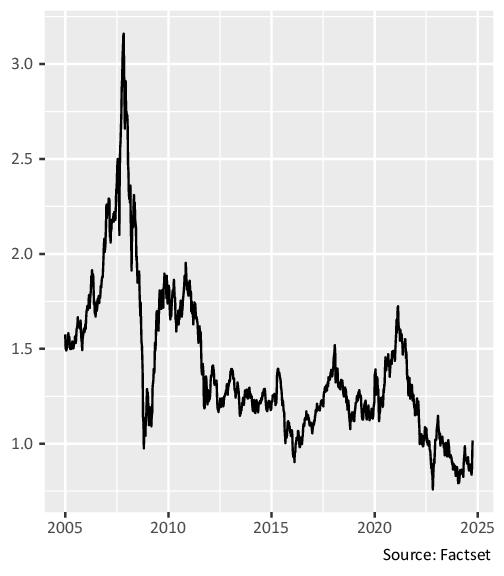
Figure 1: Hong Kong forward price-to-book ratio, last twenty years
Across the region, Hong Kong is still one of the cheapest markets in terms of price-to-book and price-to-earnings ratios (figure 2) and it is significantly cheaper than mainland China.
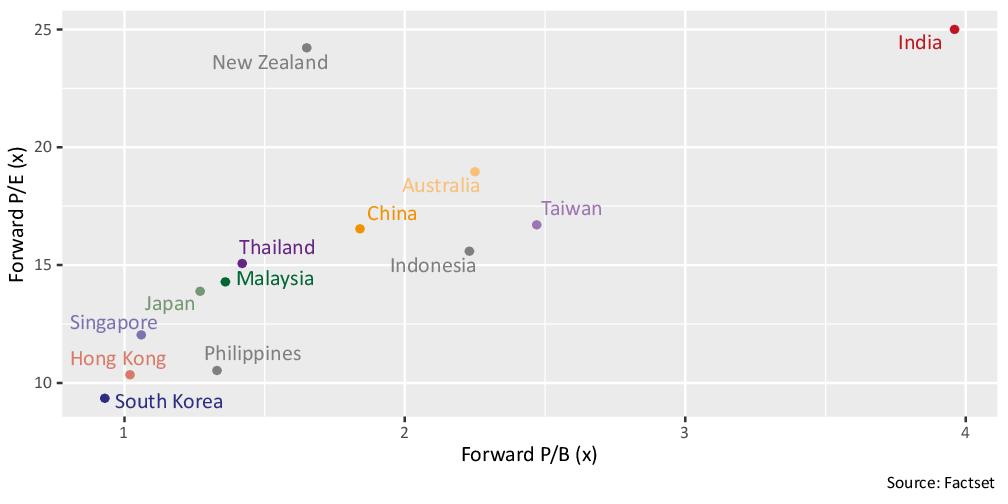
Figure 2: Asia-Pacific market price-to-earnings and price-to-book ratios, 1 October 2024
Given the divergence in valuations between Hong Kong and the rest of the region, relative value strategies which take positions in Hong Kong versus other markets should continue to perform well if the rally continues, and the consequent volatility and dispersion should create more shorter-term trading opportunities.