We present an update of the value vs. growth draw-down chart featured in past newsletters.
(below; note, french is Professor Kenneth R. French’s dataset of US stocks which goes back almost one hundred years, and mxap is the MSCI Asia-Pacific universe which has less history but which is more applicable to Metrica’s target universe).
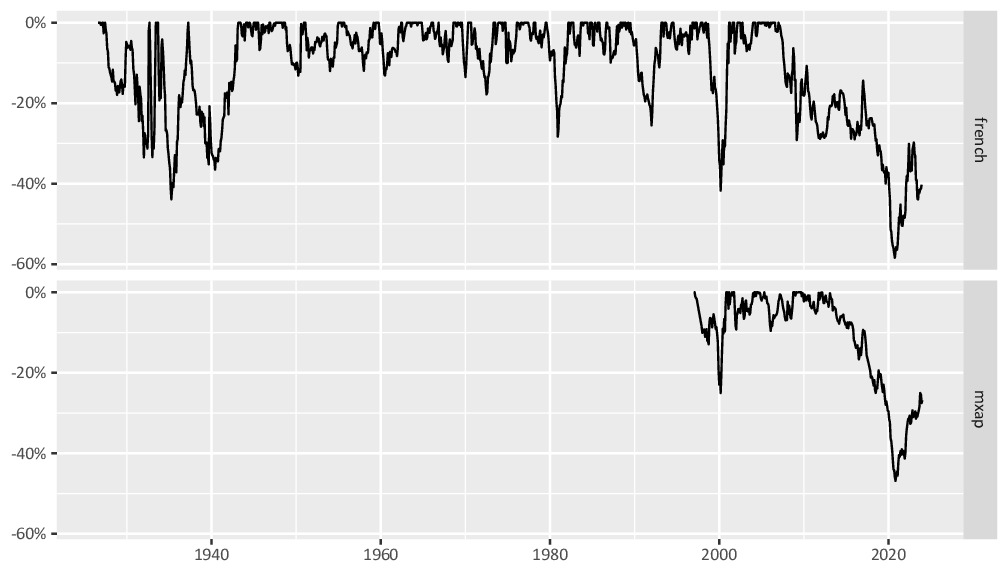
Draw-down from peak return for value vs. growth, 1926 to present
The chart is relevant because it shows the extent to which value investing is or is not working. It shows how, following the very steep draw-down in value performance in 2020,we have retraced around one-third of the way back to the long-term path. On this basis there is still around 40%+ upside to reach the long-term trend.
Although the extraordinary success of the largest US and global technology companies (e.g. the “Magnificent Seven”) has caused the ratio to deviate far from its historical trend, we don’t think that the technology sector will sustain this out-performance indefinitely. For the ratio to go back to its 2020 lows, we would need to see interest rates back at zero and the return of quantitative easing. Despite some softening in inflation in recent months, we believe a full-on repeat of the pre-pandemic macro environment to be highly unlikely at this point. Relative value should therefore continue to be an attractive strategy from this perspective.