We may finally have seen a turning point in the under-performance of Value.
The volatility of the Value / Growth ratio in Asia-Pacific surged to 30% on 6 November. The last time we saw a similar level was just over twenty years ago, on 10 April 2000:
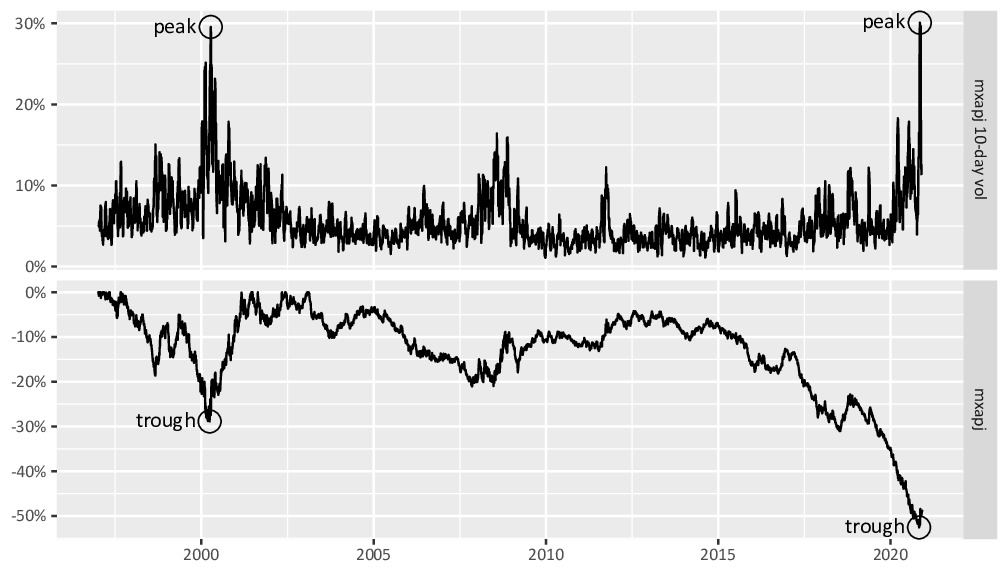
This is significant because the previous occasion marked the end of the last great period of value stock under-performance, as can be seen on the chart above.
In our last post, we explored the macro reasons why value’s under-performance may be coming to an end. It is encouraging to see additional support from a technical / chart perspective.
If history repeats itself, the upside for value could be extraordinary.
We are still close to a 94+ year draw-down for a value versus growth strategy, as measured by four separate benchmarks.
The magnitude of the current drawdown is still around 60% which is the highest ever for all four of the benchmarks, and indicates potential upside of over 150% once the draw-down ends.
While Metrica’s strategies do not directly involve buying value and selling growth, the above is still very relevant as many of the strategy’s long positions would naturally fit into the Value bucket given low price-to-NAV ratios – and the opposite is true for the hedges. This is despite both sides being ultimately exposed to the same underlying fundamentals through ownership linkages.