Implications of bear steepening
Interest rates are in focus, with long-term Treasury yields rising steadily, the curve steepening and implied volatility moving higher.
We have previously considered the effect of these trends on equity relative value performance. How about the impact on corporate merger activity? (more…)
Holding the floor
We have recently written about the potential turning point for Value versus Growth which occurred in mid-November.
To recap, we identified a sharp spike in the volatility of the Value / Growth ratio as resembling a similar event in the year 2000, which at that time marked the start of a long period of Value out-performance.
What do we need for the turning point thesis to hold? (more…)
Why are volatility spikes significant?
In our last post we highlighted a volatility spike in the Value / Growth ratio as a potential sign that the multi-year under-performance of Value might be coming to an end.
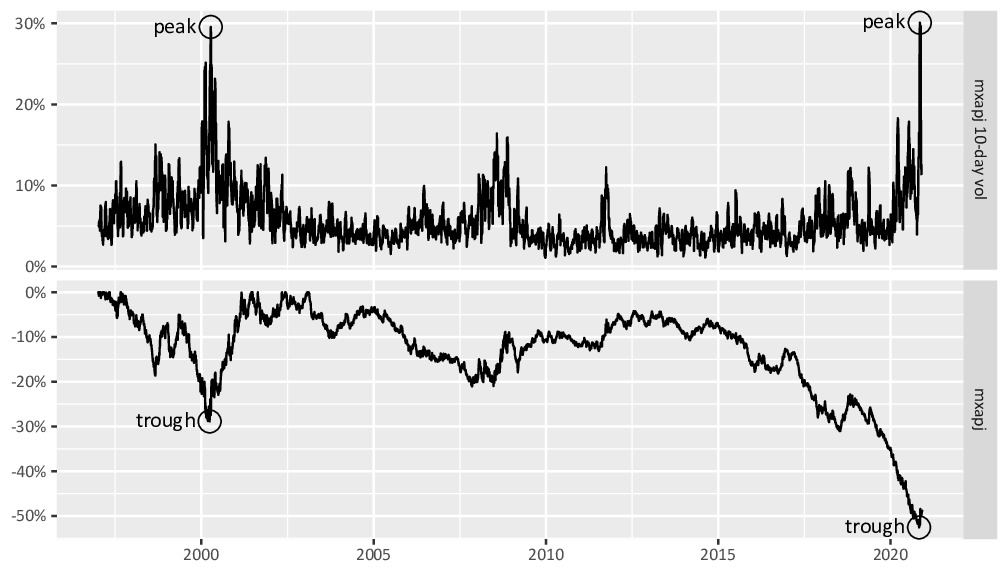
More specifically, we looked at the 10-day volatility of the MSCI Asia-Pacific ex-Japan Value index divided by MSCI Asia-Pacific ex-Japan Growth index, which in November spiked to 30 for the first time in twenty years.
The last time this happened marked the start of a long period of Value outperformance.
Volatility spikes are often associated with market turning points. Why? (more…)
A turning point?
We may finally have seen a turning point in the under-performance of Value.
The volatility of the Value / Growth ratio in Asia-Pacific surged to 30% on 6 November. The last time we saw a similar level was just over twenty years ago, on 10 April 2000:
This is significant because (more…)
Worst performance of value since 1926
We continue to have a strong conviction in a strategy of buying companies at 80-90% discount to NAV, with an expectation of a catalyst for value realisation.
While over the long-term this has proven to be a very effective strategy, it has performed poorly over the past year.
What could be the cause? We believe the global underperformance of the value factor is the main culprit.
We have previously illustrated this using benchmarks from MSCI and Russell Investments. However, to show just how extreme the current moves are, (more…)